This week, on October 28th and 29th, we are hosting the third annual Value Investing Conference. The title of the conference is “Reset vs. Recovery: the Macroeconomy and Value Investing.” We have confirmed a range of provocative and compelling speakers. Some 600 people have registered to attend. (To learn more about the conference and reserve a place, please click here.)
The conventional wisdom is that with the onset of the Subprime Crisis, the American–and world—economies entered an economic “reset,” a downward step-function change in income, welfare, and lifestyle. The point of the conference is to explore the attributes of the present “reset” and to exchange ideas about the investing opportunities it presents.
The conventional wisdom warrants critical thinking. The economic outlook certainly seems serious. But the bursting of the Internet and housing bubbles taught us to be skeptical about the indefinite extrapolation of a trend in prices. Markets can overshoot on the upside as well as the downside. There is considerable research to confirm the overshooting phenomenon. How do we know that this—right now—is a “reset” rather than a garden-variety recession?
The official arbiter of recessions, the National Bureau of Economic Research (NBER), defines a recession as roughly at least two successive quarters of negative growth in national income as measured by Gross Domestic Product (GDP). NBER has identified about 20 recessions in each of the 19th and 20th Centuries.
Presumably a “reset” entails worse conditions than a recession, though no one says how much worse. Some pundits have pointed to the Great Depression (1929-1939), the “Long Depression” (1873-1879), or the depression of 1893-7 as model resets.
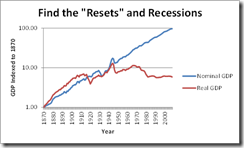
This table suggests that the iconic “resets” in U.S. economic history dwarf the current episode. Maybe we should look at “real” GDP, that is GDP with the effects of currency inflation removed. The following figure graphs nominal and real GDP (measured in 2009 dollar values), as indexed to the starting value in 1870. The vertical axis measures the indexed values on a logarithmic scale. This makes it easy to identify the change in values in percentage terms. Can you identify the “resets” in this history?
In real terms, the iconic “resets” of the past look relatively insignificant. Rather, the visible “resets” are all associated with demilitarization following expensive wars: World Wars I and II, and the Vietnam War. The other sobering detail in this figure is that in real terms, the U.S. economy has grown little since about 1980.
Are we in a “reset” now? Go figure. The discussion in this conference should be very interesting.


