Environmental enforcement, and the role of the states in implementing federal pollution policy, are contentious. These topics are the subject of extensive recent media attention. This is therefore an opportune time to recap what we know about environmental enforcement and the decentralization of pollution oversight. We focus on water quality.
Researchers and policymakers devote significant attention to the design of environmental regulation, but how policy is implemented and enforced in the real world receives less consideration. This is especially true for domestic water policy, where 1972’s Federal Water Pollution Control Act (i.e. “the Clean Water Act”) remains the signature law. The regulatory “action” in U.S. water quality is largely in enforcement and compliance.
The resources at stake with CWA enforcement are sizable. States and the federal governments spend billions per year simply monitoring and enforcing pollution control laws. Estimates suggest private firms spend around 0.2 to 1 percent of GDP per year complying with the Clean Water Act (CWA). That’s as much as 180 billion dollars annually.
The environmental quality issues at stake are also substantial. The most recent nationally representative water quality assessment estimates that around 55% of U.S. river and stream miles, 70% of lake acreage, and 78% of estuary and bay square mileage are not safe for fishing, swimming, or other beneficial uses (USEPA 2017). As much of 75% of the US population lives within 10 miles of an “impaired” waterway.
Given the large benefits and costs at stake, it is no surprise that CWA oversight is controversial. It is therefore imperative to understand if and how CWA monitoring and enforcement work in the real world. Do inspections and penalties improve compliance and reduce pollution? Do inspections and penalties achieve a reasonable policy “bang per buck” relative to alternatives? Are current enforcement policy priorities likely to result in improved water quality?
To understand the issues, it is useful to provide some context. First, CWA regulators have many enforcement options. Tools range from informal actions like telephone calls and warning letters to formal administrative orders with or without monetary fines.[1] Second, although policy is set at the federal level, CWA permitting, inspection, and enforcement activities are delegated to state and local authorities. With few exceptions, states are the CWA regulators and EPA offices provide only loose oversight. Third, these decentralized regulators have discretion over the frequency and severity of monitoring and enforcement activity. Regulations are vague and flexible, facilities’ pollution and compliance outcomes are complex, agency enforcement resources are scarce, and political and community pressures are acute.
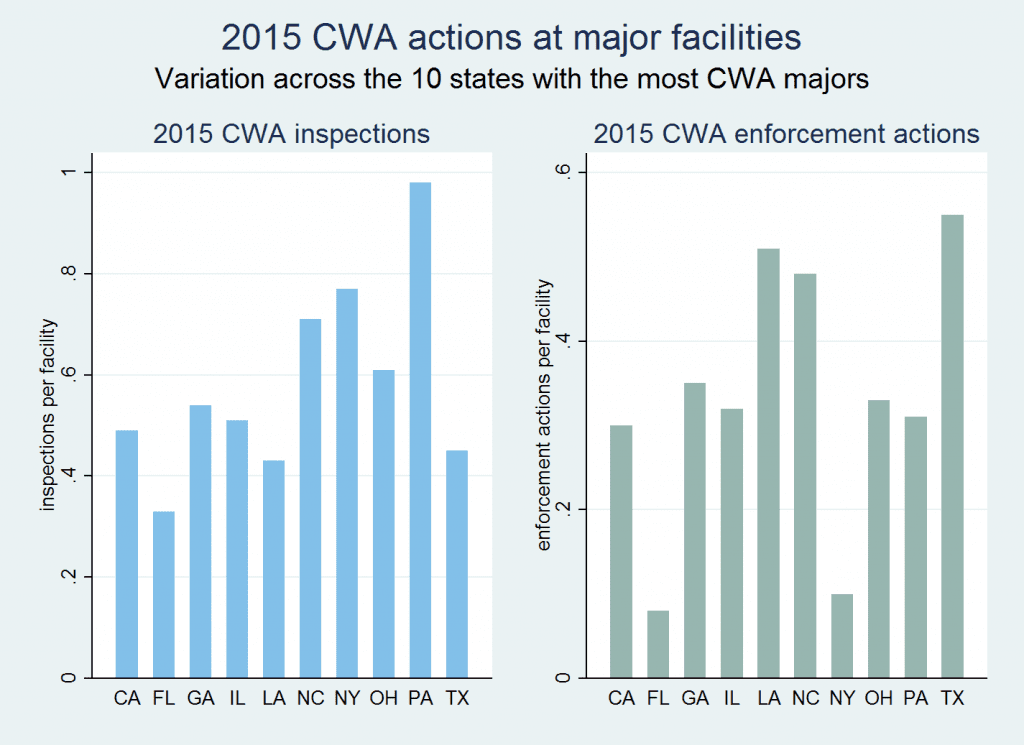
The frequency and severity of monitoring and enforcement vary – a lot – across states and across time. For illustration, the Figure below illustrates variability in CWA monitoring and enforcement across the ten states with the most major facilities in 2015.[2] The figure shows, for example, that the typical CWA major in Pennsylvania was inspected three times more often than the typical CWA major in Florida. In 2015, there were about 0.1 enforcement actions per CWA major in New York and around 0.5 enforcement actions per CWA major in Texas.[3]
So, what do we know about CWA enforcement? Gray and Shimshack (2011) and Shimshack (2014) review the quantitative evaluation literature. One clear lesson is that informal CWA enforcement actions have limited effects on current or future compliance. Another clear lesson is that more formal CWA enforcement actions with “teeth” get results. Monetary fines have “direct compliance effects,” where case resolutions immediately reduce environmental harm. Fines spur “specific deterrence,” where penalized facilities reduce pollution and improve compliance for some time into the future. Fines spur “beyond compliance behavior,” where enforcement induces facilities to reduce pollution well below legally allowed levels. The basic intuition is that facilities may over-comply in order to avoid accidental violations or violations on co-moving pollutants. Finally, fines spur “general deterrence,” meaning that enforcement actions spill over to reduce pollution and improve compliance at other facilities in the same state that were not targeted by the sanction. Fines establish the state regulator’s reputation for toughness, and so actions targeting one facility affect all facilities’ subsequent behavior.
Evans et al. (2018), however, shows that CWA enforcement actions also spill over to increase pollution from plants in the same industry but located in other states. This unintended “enforcement leakage” represents something akin to squeezing a balloon – increased regulatory pressure in one state leads to reduced pollution in that state but more pollution among similar facilities in nearby states with less regulatory pressure at that time. This unintended “enforcement leakage” can undermine some, and possibly much, of the overall net environmental quality benefits of pollution oversight.
Why do these lessons matter? For decades, scholars and policymakers have called for reduced emphasis on traditional monitoring and enforcement tools in favor of more cooperative, voluntary, or information-based approaches to compliance. Additionally, the current Environmental Protection Agency administration defines its key enforcement agenda around “restoring power to the states.” The work discussed above provides cautionary notes for these two policy proposals. Shimshack (2014) documents that traditional inspections and fines reduce pollution. In contrast, the impacts of voluntary, cooperative, and information-based compliance programs are far more ambiguous. Evans et al. (2018) illustrates that more, not less, coordination across states may be necessary to alleviate enforcement leakage. Collectively, current policy proposals may have important consequences for water quality.
Jay Shimshack is Associate Professor of Public Policy and Economics at UVa’s Frank Batten School of Leadership and Public Policy. His research focuses on environmental and natural resource economics and regulation.
References
Evans, M. F., Gilpatric, S. M., & Shimshack, J. P. (2018). Enforcement spillovers: Lessons from strategic interactions in regulation and product markets. Available at SSRN: https://ssrn.com/abstract=2664765 or http://dx.doi.org/10.2139/ssrn.2664765 .
Gray, W. B., & Shimshack, J. P. (2011). The effectiveness of environmental monitoring and enforcement: A review of the empirical evidence. Review of Environmental Economics and Policy, 5(1), 3-24.
Shimshack, J. P. (2014). The economics of environmental monitoring and enforcement. Annual Review of Resource Economics 6(1), 339-360.
UPEPA, National Water Quality Inventory: Report to Congress, August 2017, EPA 841-R-16-011
[1] Civil and criminal judicial actions are also possible, but they are uncommon for standard water quality violations. These actions are more typically reserved for extreme environmental harm, deliberate records falsification, operating outside the regulatory system, or egregious histories of noncompliance.
[2] “Major facility” has a technical definition, but for all practical purposes CWA majors are large industrial and municipal wastewater point sources regulated under the CWA.
[3] This is not because facilities in New York didn’t violate and therefore didn’t’ “earn” enforcement actions. There are also more far more enforcement actions per violation in Texas than in New York.